The content of most library exhibitions tantalises. It’s like food you can look at but not eat: single spreads or isolated leaves of manuscript – nothing you can dip into or flick through. Even the aesthetic of print loses out when you can’t feel the quality of the paper or get a sense of the way one page follows another.
Maps are different. An almost entirely satisfactory exhibition – Lie of the Land: The Secret Life of Maps – runs at the British Library until April. There is a book due in December – it would have been good to have it now, but at least the work which has gone into the exhibition will not go unrecorded. One could do without the punning title, and an eagerness to include anything which fits that title puts too many merely amusing items alongside what is sinister or significant. But most of what is shown is wonderfully interesting and – as much to the point – most of these single sheets are whole works not fragments. They have been chosen to show how maps enable action and enter into argument; they are there to be read.
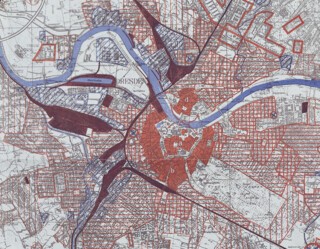
Grim reading some of them make, too. The 1941 map on which the ethnic composition of Slovakia is set out, town by town, guided Jew and Gypsy-hunters to the places where potential concentration camp victims were thickest. Made with similar efficiency, earlier on, is the plan of Nuremberg which shows how contingents to a mighty 1939 Nazi rally would make their way to the stadium. In a colour key to a series of maps of German towns made in the 1940s for British bomber pilots, various kinds of built-up area are described. Solid red, for example, denotes ‘old houses on an irregular street plan. The most vulnerable target to IB attack.’ (IB: Incendiary Bomb.) The Dresden sheet, dated December 1943 and reproduced here, predicts the city’s fate in neat red hatching with solid red at the centre. But cartography with a frisson is not new. On a map of Lancashire made for Lord Burghley around 1579, crosses have been placed beside the houses of potentially treasonable Catholic gentry. Businesslike and disinterested, such cartography strips the activities it assists of rhetorical defences.
Maps have an equally long history as strategic material. Take the maps of America’s west coast made in the late 1600s by William Hack. They are based on Spanish manuscript charts obtained in an encounter which brings to mind the rescue of Enigma code books from a German submarine in the last war. A privateer captain, Bartholemew Sharpe, caught the captain of a Spanish ship, the Santa Rosario, in the act of jettisoning them. Geographical information was sensitive. The Spaniards did not allow printed charts of the Pacific coast to be made and Sharpe’s acquisition of the manuscripts saved him from the gallows when he brought his booty home.
Sometimes maps are evidence of plans people would rather have forgotten. The copy of a map of East London produced in 1926 at the time of the General Strike shows the disposition of troops and the location of strategic resources (fire stations, barracks, power stations and so on). Its existence proves how close the powers that be thought they were to a revolution. It is unique – all copies were supposed to have been destroyed – and came to the British Library from the Ministry of Defence only in 1995. Even longer under cover was the map on which Richard Oswald, a friend of Benjamin Franklin and secretary to the British delegation which negotiated the Treaty of Paris in 1782, marked in red the proposed frontier between the United States and Canada. It was provided for the private use of his British colleagues and gives more territory to the United States than was finally agreed in 1783. The British kept the map secret until 1896. It was being used as late as 1932 as evidence in US and Canadian border disputes.
Other maps suggest the limits of military power. One of Dalmatia from 1944 plots terrain into which German tanks would be unable to pursue partisan fighters, while mapping by General Roy after the ‘45 was a preliminary to driving roads into the Highlands to bring an earlier partisan force – the supporters of Charles Edward Stuart – under control. Roy’s survey can be seen as the beginning of British national mapping and thus of the Ordnance Survey. The c.1755 version of the Highland map included in the exhibition is formidable in its thoroughness and accuracy, and huge: it rises from the floor to some feet above your head. Although the hill shading was done by the watercolour painter Paul Sandby, it is not exactly a work of art: one of the few exhibits which qualifies for that description is the map of the siege of La Rochelle engraved by Jacques Callot in 1631 and thickly peopled with the kind of tiny soldier-figures which make the scenes of horror shown in his Grandes Misères de la guerre – published a couple of years later – exquisite at first glance and terrifying on close inspection.
Precision has its own intellectual beauty. Roy’s work on the triangulation of Britain and the great national surveys such as the one done by Cassini and his colleagues in France had scientific as much as practical ends in view. The result was a degree of accuracy which confirmed (for example) that the world was a spheroid not a sphere, but which was irrelevant to the common traveller. It was gunners who needed to know to a yard the distance to a just visible farmhouse, or the exact position of a bridge hidden by hills – hence the name of the Ordnance Survey and the grid squares on their maps. New Ordnance Survey maps are, of course, not only metric but much more pacific: modern range-finding has put the prismatic compass and map case out of business. The kind of gunnery which pounded the positions inked in red on the exhibition’s trench map of Fricourt – it belonged to Siegfried Sassoon – has been replaced by guidance systems that can pinpoint buildings in cities tens or hundreds of miles away. War will press the limits of whatever information technology is current.
Heroic 18th and 19th-century feats of base-line measurement and triangulation, for a long time the basis of all accurate mapping of large areas, make a wonderful story. Although they are not what this exhibition is about, their results underlie, quite literally sometimes – as in the case of the 1926 London map (overprinted on a standard Ordnance Survey sheet) and the bombing map of Dresden – demographic and military information. Once a survey has been made it allows you to plot whatever you are interested in without remapping the topography. So William Booth in 1889 can map the distribution of the social classes in London by doing his footwork and colouring in what had already been physically surveyed. In the sheet here one can find patches of colour applied with enviable confidence: black (which indicates ‘lowest class, vicious and semi-criminal’) is given to dwellings a few blocks away from the pink of the houses of the ‘well-to-do middle class’ of Smith Square and the golden terraces of the ‘wealthy upper middle and upper class’ of Victoria Street. Another kind of social mapping can be seen in two Japanese maps: one from about 1680 which shows the position of the island on which Dutch merchants were isolated, another from 1869, which shows the city of Edo under the Tokugawa shogunate. On it are shown the houses of wealthy citizens (along with armorial signs): people who had to report to Edo annually from their provincial strongholds, and to leave family members behind as hostages. Such maps prompt two reflections. First, that topographic finesse – consistency of scale, for example, which ensures that any one centimetre on the map represents the same specific distance on the ground – is not important for many, even most, maps: it’s often an unconsidered consequence of the nature of the map on which information is being plotted. On the London Tube map it is topological rather than topographical information that we’re being given.
The second reflection is that maps – hybrids of picture and text which do not impose a sequential reading – are the most fully developed of the artefacts which prefigure the structures of current sources of electronic information. At the very beginning of the exhibition there is a large aerial view of London provided by getmapping. com, an Internet company which will sell you a photograph of any bit of Britain you care to ask for and who have just issued an atlas of aerial photographs of London (HarperCollins, £50). The result is fascinating – particularly if you take imaginary walks through places you know – but most of what you see in such photographs is either enigmatic (launching sites of V2 rockets at Peenemunde and of missiles in Cuba needed interpretation) or entirely without what you turn to town maps for: street names, public houses, rights of way and so on. It’s lines which matter. I can think of no slanderous caricature or ribald verse to match the incendiary potential of the maps and plans which nibble a couple of feet off a back garden or a sliver of mountain wilderness off a province.
Send Letters To:
The Editor
London Review of Books,
28 Little Russell Street
London, WC1A 2HN
letters@lrb.co.uk
Please include name, address, and a telephone number.


